Filters
USA

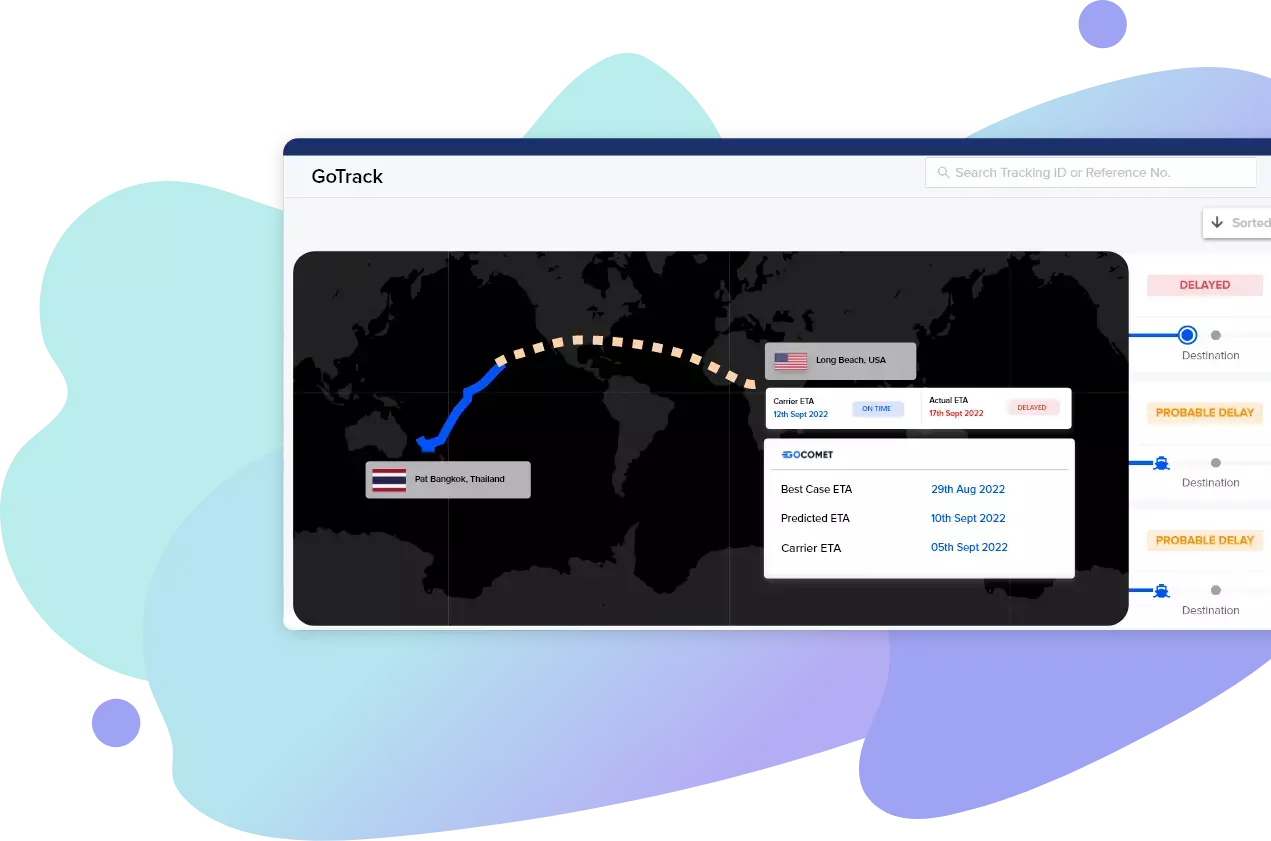
The Port of Long Beach is the second busiest container port in the United States, adjoining the Port of Los Angeles. The port is a major gateway for US-Asian trade and is often congested due to various global supply chain crises. Our data-driven port congestion tool helps global shippers to proactively respond to congestions at the Port of Long Beach by accurately calculating the median congestions of the port at any given time.
Port Delay by Country


Need weekly report on port congestion for your desired ports?
shipments do not arrive on-time at USA region
has the highest shipments arriving on-time for USA region
GoComet launched revolution!
Stay up to date with live weekly
congestion status of your ports

In today's globalized world, efficient supply chain management is crucial for businesses to thrive. However, disruptions such as port congestion can significantly impact delivery schedules, leading to frustrated customers and compromised production c...
# blog

Global port congestion in Q1 2023 has improved significantly from its peak in Q4 2021, but it is still far from normal. The main factors that have contributed to the improvement are the easing of COVID-19 restrictions, the return of some ships to ser...
# blog


GoComet’s Port Delay smart tool calculates the delays at major ports across the globe and gives the live port congestion data to the users.
GoComet’s port congestion tracker analyzes more than 45000 containerized shipments per month at major ports across US, EU, EMEA and SEA regions. Supported by GoComet platform’s real-time container tracking data, our machine learning algorithm calculates congestion/delays at ports based on the turnaround times of these containers at a given arrival/departure port.
Our delay calculation logic takes into account the time spent by vessels in proximity to the port (ideally, anchorages or queues) and the time taken by the container to gate-out (be cleared) from the port once the vessel arrives at the port to build real on-ground delays.
GoComet’s port congestion tracker analyzes more than 45000 containerized shipments per month at more than 400 major seaports spread across US, EU, EMEA and SEA regions.
In this same page, scroll above and enter a port name under the option “Search your preferred port”. You will find the live port congestion data for that particular port.
The calculated congestion index is a median value which would hold true for a maximum number of cases (excluding outliers). Median delay indicates the average number of days your shipment could be delayed due to port congestion
Yes! GoComet’s port congestion API can be integrated with any client ERP system and the data pulled out can be used to create your own interface as per the client’s use case.
GoComet’s port congestion data gives real-time visibility over port congestion that uses a combination of multiple sources such as AIS data, geofencing around ports and live container events data – collected from over 45000 containers tracked every month. This enables us to give accurate port congestion data as opposed to historic coverage given by other data providers in the market.
You can click on the "Sign in" option at the top of this page and then scroll down the login form that opens and click on "sign up" displayed at the bottom. Now you can sign up as a new user either using your company email ID or your Google account. Using these credentials you can have access to our port congestion database along with other free tools and getreal-time free container tracking tool, smart ocean/vessel schedules andshipping rates market index (GFI) for free!
In order to get custom post congestion reports for your team or customers, you can and contact our solutions expert.
Yes, we do. You can click on our Free tools menu on the website, and you will find the following free tools along with Port Congestion:
Container Tracking – Get unprecedented visibility over all your international shipments with our single window tracking solution. You can eliminate the need for manual container tracking and can stay updated with real-time automated notifications on the movement of your freight.
GoComet Freight Index – GoComet freight shipping calculator helps to calculate ocean & sea container shipping rates instantly. You can check real-time cost, price, rates and more with our international freight shipping calculator.
Smart Schedule – This tool provides instant access to the latest sailing schedules, benchmarked freight rates & carrier performance. You can search for your preferred route by entering the origin and destination port.
Prolonged port delays can disrupt production cycles, thus causing an impact on the delivery schedules. As vessels queue outside ports and turnaround times increase, it could be a real challenge to secure cargo space. Adding to this, a lack of visibility over space availability and changes in lead times complicate shipment planning. Keeping stakeholders informed about the changes in arrival timings, delays in transshipment, etc., became increasingly difficult due to a lack of reliable information on port delays and inefficiencies in tracking updates.
Yes, you can most certainly do that. Please click on “Contact Us” on the top of this page and just enter your email ID. We will get in touch with you. Alternatively, you can also click here to schedule a free demo.
Yes, you can. Our customer support team will tailor-make your project proposal in accordance with your industry, logistic operations and specific requirements.